
Volatility is the price of adoption from zero. This lesson is about what it has actually looked like, so that you are not surprised.
The record
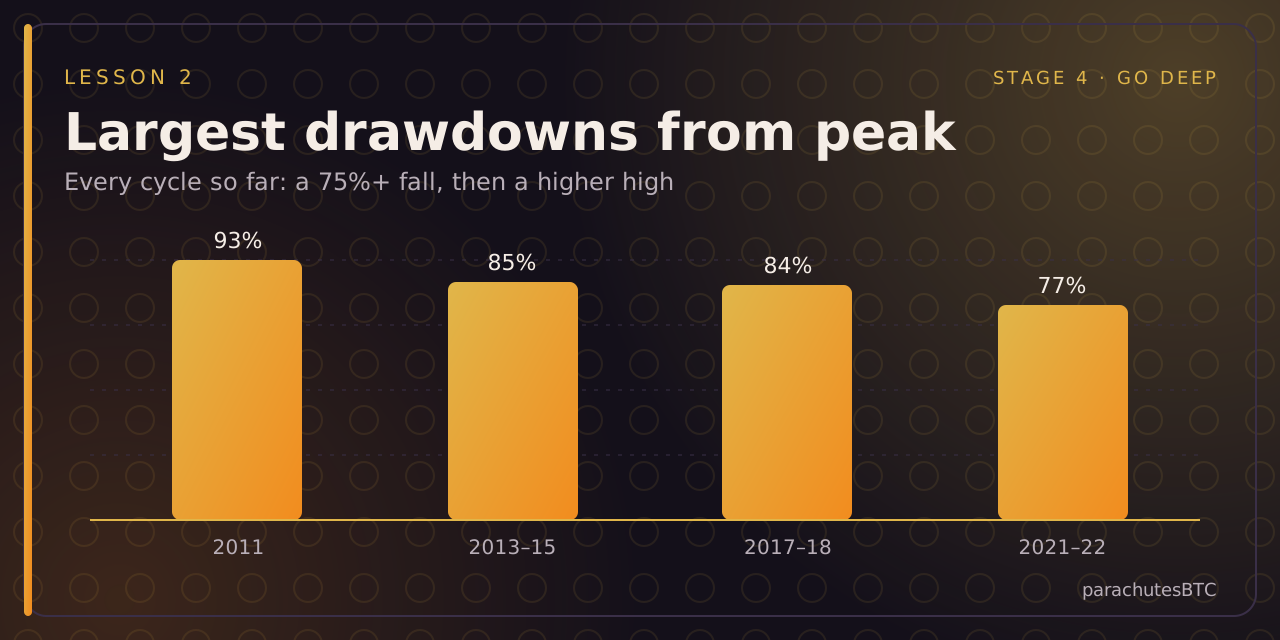
- 2011: from about $32 to $2, a 93% fall.
- 2013 to 2015: from about $1,150 to $170, 85%.
- 2017 to 2018: from about $19,700 to $3,200, 84%.
- 2021 to 2022: from about $69,000 to $15,500, 77%.
Each fall lasted a year or more. Each was called the end of bitcoin. Each was followed by a new all-time high. The drawdowns have shallowed slightly, which fits a growing market, but there is no law that says the next one will be smaller.
What this means in practice
- Money you need within a few years does not belong in something that can halve. That is not bearishness; it is arithmetic.
- Most people who "lost money in bitcoin" sold during a drawdown or used leverage. Holding through a 77% fall is psychologically brutal and only possible with money you can leave alone.
- Volatility cuts both ways. The same property that produces the drawdowns produces the recoveries.
Measuring it
Realised volatility (how much the price actually moved) has trended down across cycles, from well over 100% annualised in early years toward the 40 to 60% range. Gold is around 15%, the S&P 500 around 15 to 20%. Bitcoin is still three to four times as volatile as stocks, and the drawdown and recovery tool shows what each fall took to recover.
After a 75% fall, by what percentage must the price rise to get back to the previous peak?